Preface
The first part of this article is translated from Chrome DevTools documentation: How to Use the Timeline Tool
Did this thing last year too, see Chrome DevTools, Chrome version and documentation are continuously updating, Timeline panel functionality is more powerful, layout has also undergone some changes
I. Translation
Use Chrome DevTools' Timeline panel to record and analyze all activities during application runtime, can be used to investigate application performance issues
[caption id="attachment_1260" align="alignnone" width="625"]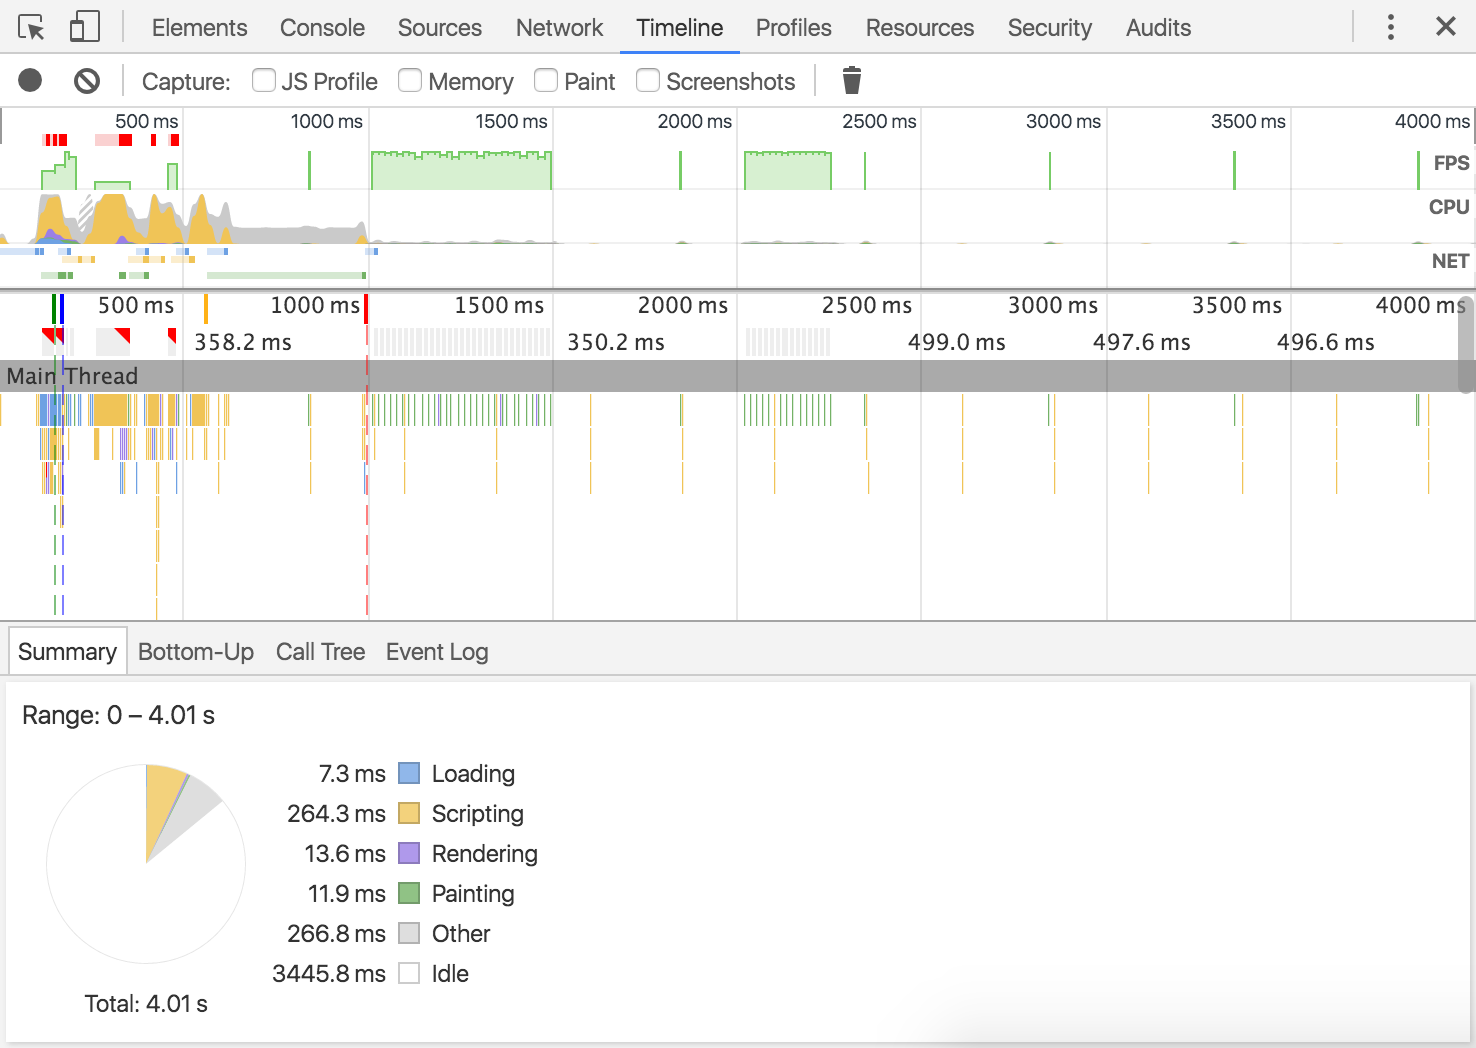 timeline-panel[/caption]
Content Summary
-
Generate timeline records to analyze all events that occur after page load or user interaction
-
View FPS, CPU and network requests in the overview pane
-
Click each event in the flame chart to view its detailed information
-
Can zoom into a portion of the record for analysis
Timeline Panel Overview
[caption id="attachment_1263" align="alignnone" width="938"]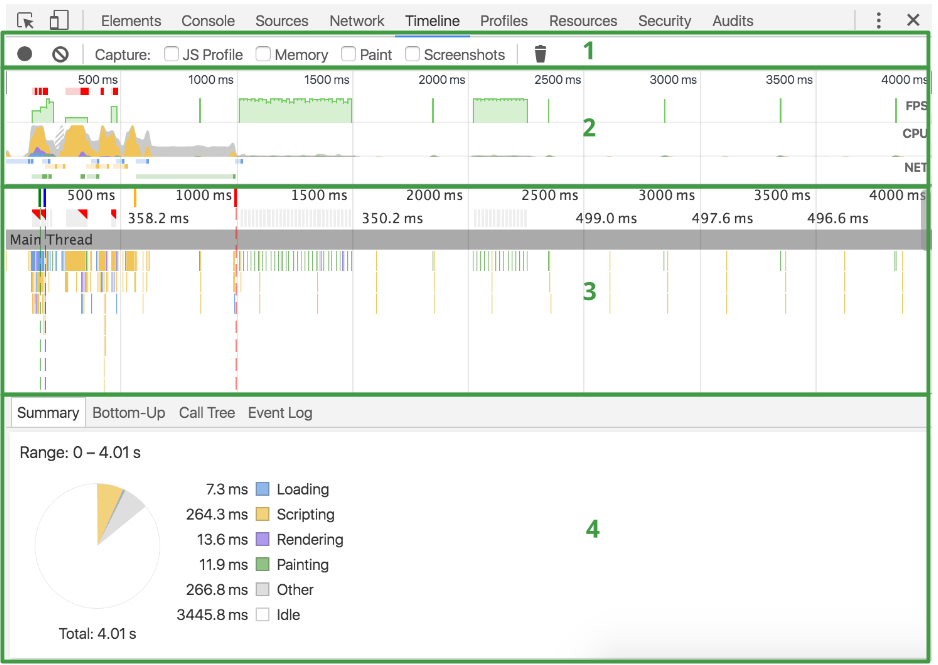 timeline-annotated[/caption]
Timeline panel from top to bottom:
-
Control options
Start recording, stop recording, configure what information to capture during recording
-
Overview
High-level summary of page performance, more content below
-
Flame chart
Visual representation of CPU stack trace
May see 3 vertical dashed lines on the flame chart, blue line indicates
DOMContentLoadedevent, green line indicates first paint time point, red indicatesloadevent -
Details
After selecting an event, the details pane at the bottom displays detailed information about the event. When no event is selected, displays comprehensive information for the selected time range
Overview Pane
[caption id="attachment_1265" align="alignnone" width="954"]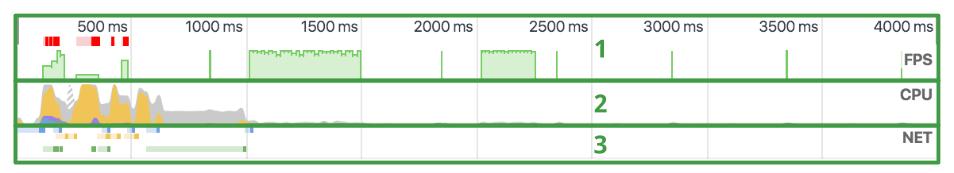 overview-annotated[/caption]
Includes 3 types of charts:
-
FPS
Frames per second. The higher the green bar, the higher the FPS. Red blocks above the FPS chart indicate long frames, likely to cause jank
-
CPU
CPU resources. Area chart indicates which type of events consumed CPU resources
-
NET
Each colored bar represents a resource, the longer the bar, the longer it takes to fetch the resource. The lighter part on each bar indicates wait time (from requesting resource to getting first byte). Darker part indicates data transfer time (from getting first byte to getting last byte)
Bar color meanings are as follows:
  HTML: blue
  Scripts: yellow
  CSS: purple
  Media: green
  Other miscellaneous resources: gray
Generating Records
Open Timeline panel, open the page you want to record, then reload the page. Timeline panel will automatically record the reload process
To record page interaction, first open Timeline panel, then click the record button or press shortcut Cmd+E (Mac) or Ctrl+E (Windows/Linux). Record button turns red indicates recording. Perform page interaction, then click the record button again or press keyboard shortcut to stop recording
When recording ends, DevTools will guess which part you care about most, and automatically select that part
Warm tips:
-
Keep the recording process as short as possible. Shorter is easier to analyze
-
Avoid unnecessary actions. Avoid external actions unrelated to the part you want to record and analyze (mouse clicks, network loading, etc.). For example, if you want to record events that occur after clicking the login button, don't scroll the page, load images, etc. at the same time
-
Disable browser cache. When recording network operations, it's best to disable browser cache through DevTools settings panel or Network conditions tab
-
Disable extensions. Chrome extensions can affect application's Timeline recording, can open Chrome window in incognito mode, or create a new Chrome user profile to ensure environment has no extensions
Viewing Record Details
[caption id="attachment_1269" align="alignnone" width="936"]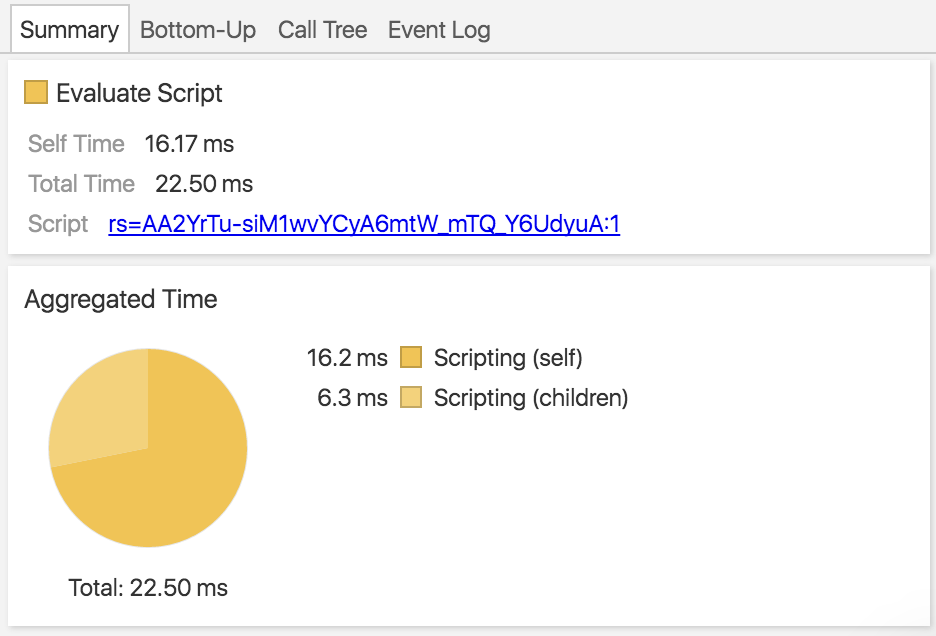 details-pane[/caption]
After selecting an event in the flame chart, the details pane will display additional information about the event
Some tabs exist in all event types, like Summary, some tabs only exist in certain event types, for detailed information about record types, see Timeline event reference
Taking Screenshots During Recording
[caption id="attachment_1270" align="alignnone" width="625"]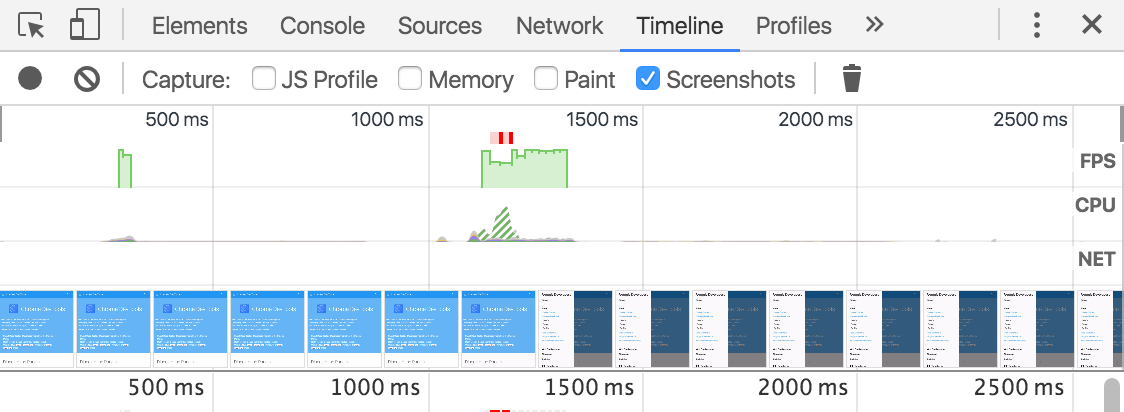 timeline-filmstrip[/caption]
Timeline panel can take screenshots during page loading process, this feature is like film strip
Before starting recording, check the Screenshots checkbox in the control pane, will record screenshots, screenshots display below the overview pane
Hover mouse over screenshots, or on the overview pane, can view enlarged screenshots at that time point. Moving mouse from left to right can simulate animation effect
JS Performance Analysis
[caption id="attachment_1271" align="alignnone" width="625"]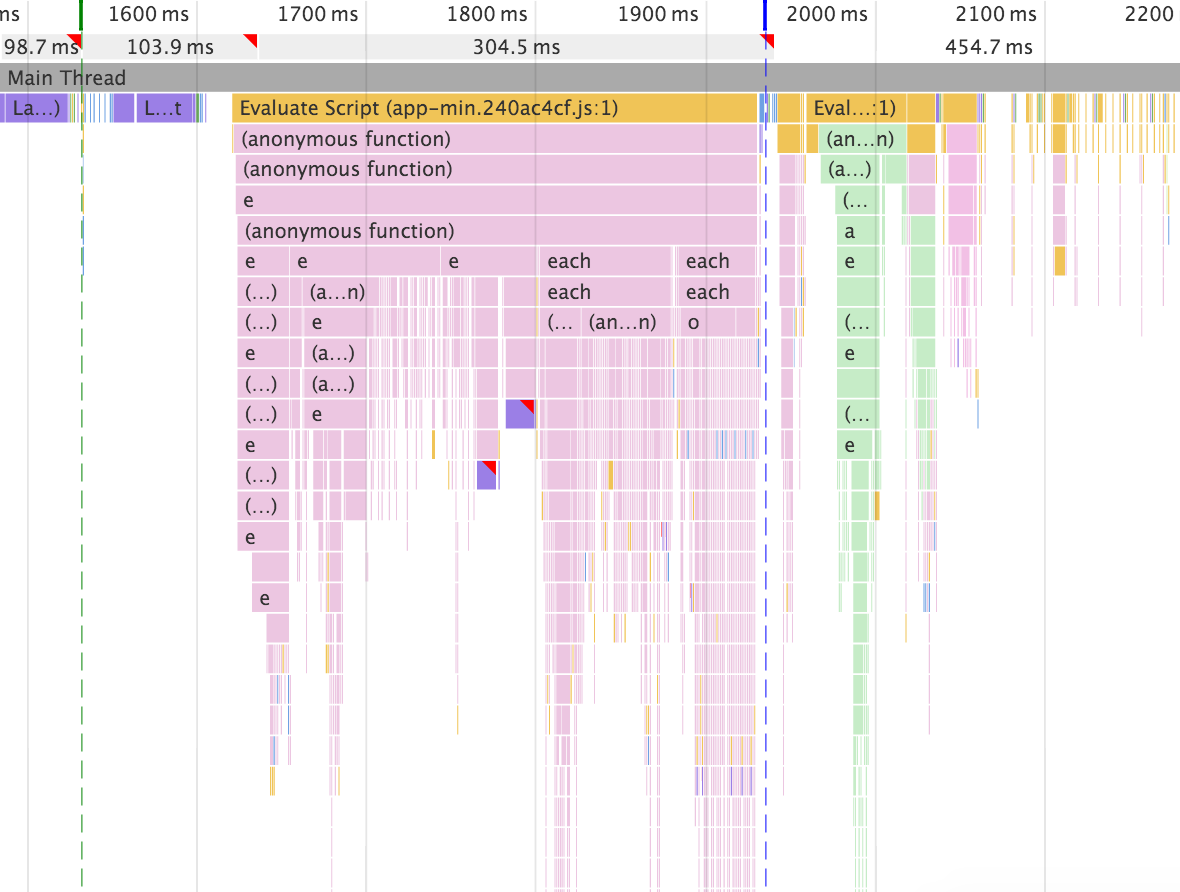 js-profile[/caption]
Before starting recording, check the JS Profile checkbox to capture JS call stack in timeline records. When JS Profile is enabled, the flame chart will display each called JS function
Paint Performance Analysis
[caption id="attachment_1272" align="alignnone" width="625"]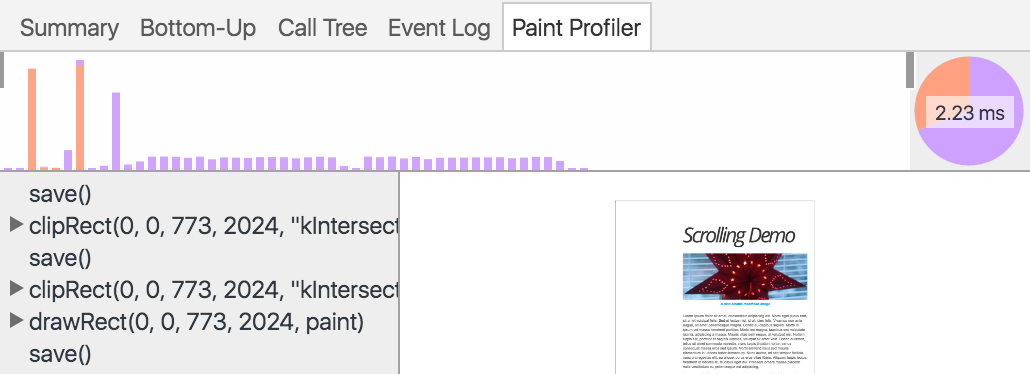 paint-profiler[/caption]
Before starting recording, check the Paint checkbox to view Paint events in depth. After enabling paint performance analysis, when clicking a Paint event, the Paint Profiler tab will appear in the details pane, displaying finer-grained event information
Rendering Settings
[caption id="attachment_1273" align="alignnone" width="822"]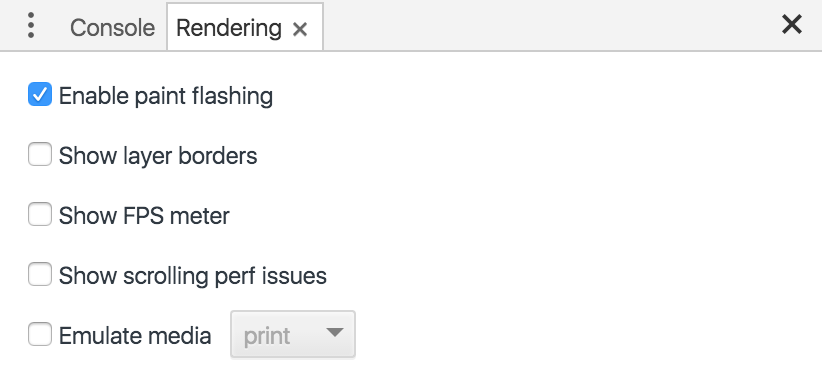 rendering-settings[/caption]
Open the main DevTools menu and select More tools > Rendering settings for rendering settings, may help debug drawing problems. After rendering settings is opened, it's a tab, next to the Console tab (if not present, press esc to display)
Finding Records
[caption id="attachment_1274" align="alignnone" width="690"]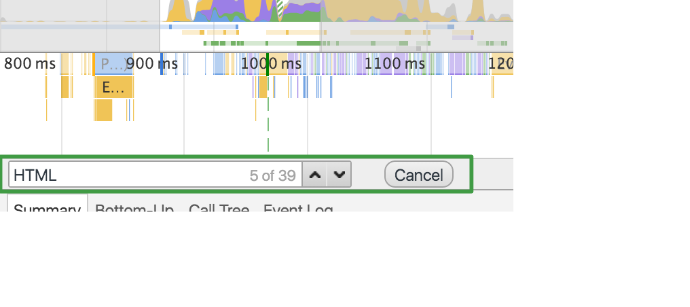 find-toolbar[/caption]
When viewing events, may only want to focus on one type of event. For example, may need to view detailed information for each Parse HTML event
Press Cmd+F (Mac) or Ctrl+F (Windows/Linux) in the Timeline panel to open the find toolbar, enter the event type name you want to view, such as Event
Toolbar is only valid for the currently selected time frame, all events outside the selected time frame will not appear in the find results
Move through results in time order via up and down arrows. So the first result is the earliest event in the selected time period, the last is the latest. Each time clicking up or down arrow, a new event will be selected, so can view its detailed information in the details pane. Clicking up and down arrows is equivalent to clicking events in the flame chart
Zooming into a Time Period
[caption id="attachment_1275" align="alignnone" width="625"]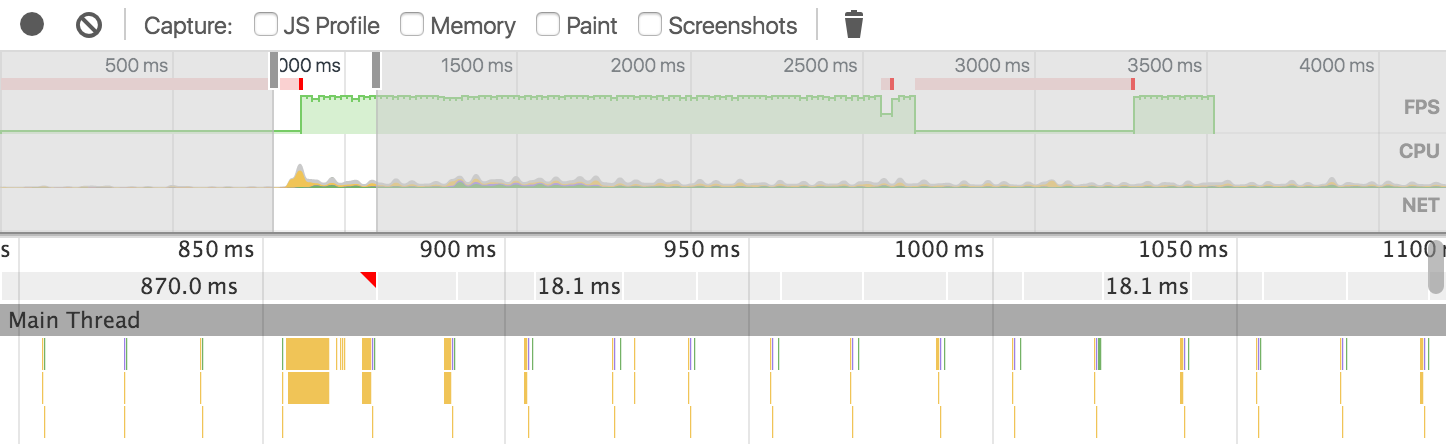 zoom[/caption]
Can zoom into a portion of the record, making it easier to analyze. Can use the overview pane to zoom into a portion of the record, after zooming, the flame chart will automatically scale to correspond to this portion
To zoom into a portion of the timeline:
-
In the overview pane, use mouse to drag and select a portion of the timeline
-
Adjust the gray slider in the ruler area
After selecting a portion, can use WASD to adjust the selection. W and S are zoom in and out, A and D are move left and right
Exporting and Importing Records
[caption id="attachment_1276" align="alignnone" width="517"]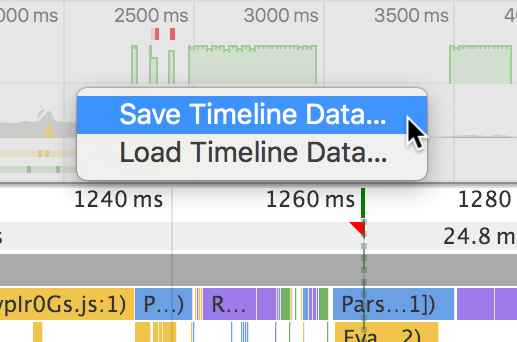 save-open[/caption]
Can save and open by right-clicking in the overview or flame chart pane, and select related options
II. Animation Performance Indicators
Frame Rate
Most intuitive is frame rate (unit is FPS, indicating frames per second), below 30 human eyes can feel obvious stutter, above 60 eyes can't tell the difference, 30-60 basically smooth
Performance goal is to make animation frame rate reach 60FPS as much as possible, so there won't be a stuttering feeling, so animation libraries generally do this:
/* rAF shim. Gist: https://gist.github.com/julianshapiro/9497513 */
var rAFShim = (function() {
    var timeLast = 0;

    return window.webkitRequestAnimationFrame || window.mozRequestAnimationFrame || function(callback) {
        var timeCurrent = (new Date()).getTime(),
                timeDelta;

        /* Dynamically set delay on a per-tick basis to match 60fps. */
        /* Technique by Erik Moller. MIT license: https://gist.github.com/paulirish/1579671 */
        timeDelta = Math.max(0, 16 - (timeCurrent - timeLast));
        timeLast = timeCurrent + timeDelta;

        return setTimeout(function() {
            callback(timeCurrent + timeDelta);
        }, timeDelta);
    };
})();
If requestAnimationFrame is supported, use it directly, let browser decide execution frequency (generally greater than 60 times per second), if not supported, fallback is setTimeout:
// 16 = 1000 / 60
timeDelta = Math.max(0, 16 - (timeCurrent - timeLast));
To reach 60 times per second, execution interval cannot exceed 16ms, so setTimeout delay time is generally 16 - time required for function execution, if function execution time exceeds 16ms, delay is 0
Many factors affect frame rate, such as compute-intensive JS tasks occupying large chunks of CPU time causing animation-related JS to execute late, layout changes causing frequent re-rendering Rendering/Painting time consumption increases, composite layers too large or too many causing Composite Layers time consumption increases and GPU drawing pressure increases time consumption lengthens, etc.
Memory
Originally animation has no direct relationship with memory, but because of hardware acceleration, there's a relationship of animation elements apply hardware acceleration -> create composite layer -> consume memory
Because CPU and GPU don't share memory, so creating composite layer needs to package bitmap data corresponding to element rendering and send to GPU, this data is "memory consumed by animation", so animation stutter, may be self-inflicted, memory is also one of animation performance indicators
Corresponding to animation, it's number of composite layers and size of composite layers, the more and larger composite layers, the larger the bitmap data, the more memory consumed
III. Animation Performance Debugging Methods
For frame rate and memory aspects, there are some debugging methods:
1. What Takes the Most Time
Use Timeline tool to record a segment that feels relatively stuttery, select the part with red bars in the FPS bar, look at the Summary in the details pane at the bottom, find the most time-consuming thing from the pie chart, for example:
Range: 294ms - 1.17s
Total: 878.74?ms
29.1?ms Loading
197.0?ms Scripting
43.0?ms Rendering
4.4?ms Painting
116.3?ms Other
489.0?ms Idle
JS takes the most time, then click the Event Log tab, sort by time consumption, expand the first few items, locate to specific JS file, then analyze the reason for time consumption, consider optimization solutions
If Rendering takes the most time, then should consider simplifying HTML structure, remove unnecessary elements, simplify layout and reduce reflow; if Painting then should focus on composite layers, are there too many or too large composite layers, consider removing extra, invisible composite layers, and increase animation element's z-index, avoid implicitly creating composite layers
P.S. Suggest first enabling incognito mode, then use Timeline to record, otherwise various extensions' JS will interfere with cause localization (pie chart inaccurate)
2. What Consumes the Most Memory
Observe the memory chart during the recording period, select the peak part, find related events in the Event Log tab, consider JS related to the events
But generally JS impact is much smaller than composite layer impact, can directly view composite layer situation: drag and select the time interval with red bars in FPS in the overview pane, view the Layers tab in the details pane, expand each layer under document, focus on a few things:
-
Whether the number of composite layers meets expectations, are there layers that shouldn't appear?
-
Clicking a layer can view its size and memory consumption and the reason for creating that layer, see if memory consumption is too large?
Large-size composite layers consume a lot of memory, for example, a layer with size 375x667 consumes 1.5MB memory, if there are many such large-size layers, will occupy a lot of memory, tight memory will definitely cause stutter
And 31x31 small-size button also needs 16KB, so besides focusing on large-size animation elements, the number of composite layers is also an important factor, for example, bubbles, smoke and other animations that need a large number of small elements to implement, consider effect degradation or reduce element count, use pseudo-elements and border, outline, box-shadow and other properties to simplify complex HTML structure
P.S. For more methods about reducing composite layers, reducing memory consumption, please see [CSS Animation and GPU-Performance Optimization Techniques](/articles/css 动画与 gpu/#articleHeader10)
No comments yet. Be the first to share your thoughts.