Preface
JS memory issues often appear in Single Page Applications (SPA), generally considered to have the following scenario characteristics:
-
Long page lifecycle (users may stay for 10 minutes, half an hour, or even 2 hours)
-
Many interactive features (pages are function-oriented rather than display-oriented)
-
Heavy JS application (complex data state and view management on the front-end)
Memory leaks are a cumulative process, only becoming an issue when the page lifecycle is slightly longer (the so-called "refresh and fully recover"). Frequent interactions can accelerate the accumulation process, while display-oriented pages rarely expose such issues. Finally, relatively complex JS logic is required for memory issues to occur ("many bugs because the codebase is large, even I can't hold it"). If it's just simple form validation and submission, there's little chance of affecting memory.
So what are the standards for many interactive features and complex JS logic? At what level does it become dangerous?
In reality, even simple pages with slight interactive features (such as partial refresh) can leave memory hazards if not handled carefully, which are called memory issues when exposed.
1. Tool Environment
Tools:
-
Chrome Task Manager
-
Chrome DevTools Performance Panel
-
Chrome DevTools Memory Panel
Environment:
-
Stable, remove variable factors like network (use fake data)
-
Easy to repeat operations, reduce "accumulation" difficulty (simplify operation steps, such as removing SMS verification links)
-
No interference, exclude plugin effects (use incognito mode)
In other words (on Mac):
-
Command + Shift + Nto enter incognito mode -
Command + Alt + Ito open DevTools -
Enter URL to open the page
Then you can start pretending to work
2. Terminology Concepts
First, you need basic memory knowledge and understand the meaning of various records provided by DevTools
Mark-and-sweep
GC algorithms related to JS are mainly reference counting (IE's BOM, DOM objects) and mark-and-sweep (mainstream approach), each with advantages and disadvantages:
-
Reference counting recovers promptly (release immediately when reference count is 0), but circular references can never be released
-
Mark-and-sweep doesn't have circular reference issues (recycle if inaccessible), but recovery is not timely and requires Stop-The-World
Mark-and-sweep algorithm steps are as follows:
-
GC maintains a root list, roots are usually global variables holding references in the code. In JS, the
windowobject is an example of a global variable serving as a root. Thewindowobject always exists, so GC considers it and all its children always exist (non-garbage) -
All roots are checked and marked as active (non-garbage), and all their children are recursively checked. Everything accessible through roots will not be treated as garbage
-
All memory blocks not marked as active are treated as garbage, GC can release them back to the operating system
Modern GC technology has made various improvements to this algorithm, but the essence is the same: memory blocks marked as accessible are identified, and the rest is garbage
Shallow Size & Retained Size
Memory can be viewed as a graph composed of primitive types (such as numbers and strings) and objects (associative arrays). More vividly, memory can be represented as a graph composed of multiple interconnected points, as shown below:
  3-->5->7
  ^      ^
 /|      |
1 |      6-->8
 \|     /^
  v    /
  2-->4
Objects can occupy memory in two ways:
-
Directly through the object itself
-
Implicitly by holding references to other objects, preventing these objects from being automatically processed by the garbage collector (GC)
In DevTools' heap memory snapshot analysis panel, you'll see Shallow Size and Retained Size representing the memory size occupied by objects through these two methods respectively
Shallow Size
The size of memory occupied by the object itself. Usually, only arrays and strings have significant Shallow Size. However, the main storage of strings and external arrays is generally located in renderer memory, with only a small wrapper object placed on the JavaScript heap
Renderer memory is the sum of memory for the page rendering process: native memory + page's JS heap memory + JS heap memory of all dedicated workers started by the page. Nevertheless, even a small object may indirectly occupy a large amount of memory by preventing other objects from being processed by the automatic garbage collection process
Retained Size
The amount of memory released after the object itself and objects depending on it (objects no longer accessible from GC root) are deleted
There are many internal GC roots, most of which don't need attention. From an application perspective, GC roots include the following categories:
-
Window global object (located in each iframe). There's a
distancefield in the heap snapshot, indicating the number of property references on the shortest retention path starting from window. -
Document DOM tree, composed of all native DOM nodes accessible through traversing document. Not all nodes have JS wrappers, but if there's a wrapper and the document is active, the wrapper will also be active
-
Sometimes, objects may be retained by debugger context and DevTools console (for example, after console evaluation). So when creating heap snapshots for debugging, clear the console and remove breakpoints
The memory graph starts from root, root can be the browser's window object or Node.js module's Global object, we cannot control how root objects are garbage collected
  3-->5->7   9-->10
  ^      ^
 /|      |
1 |      6-->8
 \|     /^
  v    /
  2-->4
Among them, 1 is root (root node), 7 and 8 are primitive values (leaf nodes), 9 and 10 will be GC'd (isolated nodes), and the rest are objects (non-root non-leaf nodes)
Object's retaining tree
The heap is a network of interconnected objects. In mathematics, such a structure is called a "graph" or memory graph. A graph consists of nodes connected by edges, both represented by given labels:
-
Nodes (or objects) are labeled with the constructor name (used to construct nodes)
-
Edges are labeled with property names
distance refers to the distance from GC root. If most objects of a certain type have the same distance, with only a few objects having larger distances, it's necessary to investigate carefully
Dominator
Dominated objects are composed of tree structures, because each object has only one (direct) dominator. The dominator of an object may not have direct references to the objects it dominates, so the dominator tree is not a spanning tree of the graph
In the object reference graph, if all paths pointing to object B pass through object A, then A dominates B. If object A is the nearest dominator of object B, then A is considered B's direct dominator
In the diagram below:
  1     1 dominates 2
  |     2 dominates 3 4 6
  v
  2
/   \
v   v
4   3   3 dominates 5
|  /|
| / |
|/  |
v   v
6   5   5 dominates 8; 6 dominates 7
|   |
v   v
7   8
So 7's direct dominator is 6, while 7's dominators are 1, 2, 6
V8's JS Object Representation
primitive type
3 primitive types:
-
Numbers
-
Booleans
-
Strings
They cannot reference other values, so they are always leaf or terminal nodes
Numbers have two storage methods:
-
Direct 31-bit integer values called Small Integers (SMI)
-
Heap objects, referenced as heap numbers. Heap numbers are used to store values that don't fit SMI format (such as double type), or when a value needs to be boxed, such as setting properties on it
Strings also have two storage methods:
-
VM heap
-
Renderer memory (external), creating a wrapper object to access external storage space. For example, script source code and other content received from the web are placed in external storage space rather than copied to the VM heap
New JS object memory is allocated from dedicated JS heap (or VM heap), these objects are managed by V8's GC, therefore, as long as there's a strong reference to them, they will remain active
Native Object
Native objects are everything outside the JS heap. Compared to heap objects, the entire lifecycle of native objects is not managed by V8's GC, and can only be accessed from JS through wrapper objects
Cons String
Concatenated strings consist of pairs of strings stored and concatenated together, only connecting the content of concatenated strings when needed, such as when taking a substring of a concatenated string
For example, concatenating a and b yields string (a, b) representing the concatenation result, then concatenating d with this result yields another concatenated string ((a, b), d)
Array
Arrays are objects with numeric keys. Widely used in V8 VM to store large amounts of data, key-value pair collections used as dictionaries also use array form (for storage)
Typical JS objects correspond to two array types, used to store:
-
Named properties
-
Numeric elements
If the number of properties is very small, they can be placed inside the JS object itself
Map
An object describing the type of object and its layout. For example, maps are used to describe implicit object hierarchy structures to implement fast property access
Object group
(each in object group) Each native object consists of objects holding references to each other. For example, each node in a DOM subtree has associations pointing to its parent, next child, and next sibling, thus forming a connected graph. Native objects are not represented in the JS heap, so their size is 0. Instead, wrapper objects are created
Each wrapper object holds a reference to the corresponding native object, used to redirect commands to itself. Thus, object groups hold wrapper objects. But this doesn't form unreclaimable cycles, because GC is smart enough to release the corresponding object group when whose wrapper is no longer referenced. But if you forget to release the wrapper, it will hold the entire object group and related wrappers
3. Tool Usage
Task Manager
Used to roughly view memory usage
Entry point is Three dots in upper right -> More tools -> Task Manager, then Right-click header -> Check JS memory used, mainly focus on two columns:
-
Memory column represents native memory. DOM nodes are stored in native memory, if this value is increasing, it means DOM nodes are being created
-
JS memory used column represents JS heap. This column contains two values, what needs attention is the live value (the number in parentheses). The live value represents the amount of memory being used by accessible objects on the page. If this value is increasing, either new objects are being created, or existing objects are growing
Performance
Used to observe memory change trends
Entry point is the Performance panel in DevTools, then check Memory. If you want to see memory usage during the page's first load, Command + R refresh the page, it will automatically record the entire loading process. If you want to see memory changes before and after certain operations, click the "black dot" button to start recording before the operation, click the "red dot" button to end recording after the operation is complete
After recording is complete, check JS Heap in the middle, the blue line represents memory change trend. If the overall trend keeps rising without significant drop, confirm through manual GC: operate and record again, do manual GC several times (click the "black trash can" button) before or during the operation. If the line doesn't drop significantly at GC points and the overall trend keeps rising, there may be a memory leak
Or a more brute-force confirmation method, start recording -> repeat operation 50 times -> see if there's a significant drop caused by automatic GC. Automatic GC occurs when memory usage reaches the threshold. If there's a leak, operating n times will eventually reach the threshold, which can also be used to confirm whether the memory leak issue has been fixed
P.S. You can also see document count (possibly for iframes), node count, event listener count, GPU memory usage change trends, among which node count and event listener count changes are also instructive
Memory
This panel has 3 tools: heap snapshot, allocation profile, and allocation timeline:
-
Take Heap Snapshot, used to specifically analyze the survival status of various object types, including instance count, reference paths, etc.
-
Record Allocation Profile, used to view memory size allocated to each function
-
Record Allocation Timeline, used to view real-time memory allocation and reclamation
Among them, allocation timeline and heap snapshot are more useful, timeline is used to locate memory leak operations, snapshots are used for specific problem analysis
For more introduction about specific usage, please check Fix Memory Problems
Record Allocation Timeline
Open the timeline, perform various interactions on the page, blue bars appearing represent new memory allocation, gray represents release and reclamation. If there are regular blue bars on the timeline, there's a high probability of memory leak
Then repeatedly operate and observe to see what operation causes blue bar residue, isolate the specific operation
Take Heap Snapshot
Heap snapshots are used for further analysis to find the specific object types that are leaking
At this point, suspicious operations should already be locked. By repeatedly performing the operation and observing the quantity changes in heap snapshot items, locate the leaking object type
Heap snapshots have 4 viewing modes:
-
Summary: Summary view, expand and select child items to view Object's retaining tree (reference path)
-
Comparison: Comparison view, compare with other snapshots to see add, delete, Delta count and memory size
-
Containment: Overview view, look at the heap from top to bottom, root nodes include window object, GC root, native objects, etc.
-
Dominators: Dominator tree view, new Chrome seems to have removed it, displays the dominator tree mentioned in the terminology concepts section earlier
The most commonly used are comparison view and summary view. Comparison view can diff snapshots between 2 operations and 1 operation, see Delta increment, find out which type of object keeps growing. Summary view is used to analyze these suspicious objects, look at Distance, find out which link on the strange long path was forgotten to disconnect
There's a small tip for viewing summary view: newly added items are yellow background with black text, deleted items are red background with black text, and existing items are white background with black text. This is crucial
For more illustrations about snapshot usage, please check How to Record Heap Snapshots
4. Troubleshooting Steps
1. Confirm the problem, find suspicious operations
First confirm whether there's really a memory leak:
-
Switch to Performance panel, start recording (if necessary to record from the beginning)
-
Start recording -> operate -> stop recording -> analyze -> repeat to confirm
-
If memory leak is confirmed, narrow down the scope, determine what interaction operation caused it
You can further confirm the problem through Memory panel's allocation timeline. The advantage of Performance panel is that you can see DOM node count and event listener change trends. Even when not sure if performance is dragged down by memory issues, you can also see network response speed, CPU usage and other factors through the Performance panel
2. Analyze heap snapshots, find suspicious objects
After locking down suspicious interaction operations, go deeper through memory snapshots:
-
Switch to Memory panel, take snapshot 1
-
Perform one suspicious interaction operation, take snapshot 2
-
Compare snapshot 2 and 1, see if count
Deltais normal -
Perform one more suspicious interaction operation, take snapshot 3
-
Compare 3 and 2, see if count
Deltais normal, guess the object count change trend of abnormalDelta -
Perform 10 suspicious interaction operations, take snapshot 4
-
Compare 4 and 3, verify the guess, determine what wasn't reclaimed as expected
3. Locate the problem, find the cause
After locking down suspicious objects, further locate the problem:
-
Is the
Distanceof this type of object normal? If most instances are level 3 or 4, individual ones reaching level 10 or above is abnormal -
Look at instances with path depth 10+ levels (or obviously deeper than other instances of the same type), what's referencing them
4. Release references, fix and verify
At this point, the problem source is basically found. Next, solve the problem:
-
Find a way to disconnect this reference
-
Sort out the logic flow, see if there are references elsewhere that won't be used again, release them all
-
Modify and verify, if not resolved, re-locate
Of course, sorting out the logic flow can be done from the beginning. Analyze with tools while confirming logic flow loopholes, work on both fronts. Finally, verify by looking at the trend line in Performance panel or the timeline in Memory panel
5. Common Cases
These scenarios may have memory leak hazards. Of course, proper cleanup work can solve them
1. Implicit global variables
function foo(arg) {
    bar = "this is a hidden global variable";
}
bar gets hung on window. If bar points to a huge object or a DOM node, it will cause memory hazards
Another less obvious way is when a constructor is called directly (without calling through new):
function foo() {
    this.variable = "potential accidental global";
}

// Foo called on its own, this points to the global object (window)
// rather than being undefined.
foo();
Or this in anonymous functions, which also points to global in non-strict mode. These obvious problems can be avoided through lint checks or enabling strict mode
2. Forgotten timers or callbacks
var someResource = getData();
setInterval(function() {
    var node = document.getElementById('Node');
    if(node) {
        // Do stuff with node and someResource.
        node.innerHTML = JSON.stringify(someResource));
    }
}, 1000);
If the node with id of Node is removed later, the node variable in the timer still holds its reference, causing the游离 DOM subtree to be unable to release
Callback function scenarios are similar to timers:
var element = document.getElementById('button');

function onClick(event) {
    element.innerHtml = 'text';
}

element.addEventListener('click', onClick);
// Do stuff
element.removeEventListener('click', onClick);
element.parentNode.removeChild(element);
// Now when element goes out of scope,
// both element and onClick will be collected even in old browsers that don't
// handle cycles well.
Event listeners on nodes should be removed before removing nodes, because IE6 didn't handle circular references between DOM nodes and JS (because BOM and DOM object GC strategies are both reference counting), which may cause memory leaks. Modern browsers no longer need to do this; if nodes can no longer be accessed, listeners will be recycled
3. References to游离 DOM
var elements = {
    button: document.getElementById('button'),
    image: document.getElementById('image'),
    text: document.getElementById('text')
};

function doStuff() {
    image.src = 'http://some.url/image';
    button.click();
    console.log(text.innerHTML);
    // Much more logic
}

function removeButton() {
    // The button is a direct child of body.
    document.body.removeChild(document.getElementById('button'));

    // At this point, we still have a reference to #button in the global
    // elements dictionary. In other words, the button element is still in
    // memory and cannot be collected by the GC.
}
DOM node references are often cached (for performance or code simplicity considerations), but when removing nodes, cached references should be released synchronously, otherwise游离 subtrees cannot be released
Another more hidden scenario:
var select = document.querySelector;
var treeRef = select("#tree");
var leafRef = select("#leaf");
var body = select("body");

body.removeChild(treeRef);

//#tree can't be GC yet due to treeRef
treeRef = null;

//#tree can't be GC yet due to indirect
//reference from leafRef

leafRef = null;
//#NOW can be #tree GC
As shown below:
[caption id="attachment_1464" align="alignnone" width="368"]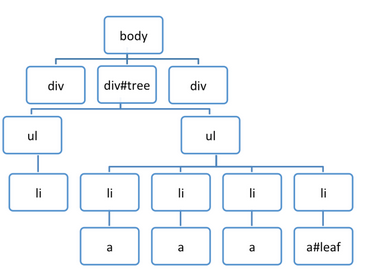 treegc[/caption]
If any node reference in a游离 subtree is not released, the entire subtree cannot be released, because all other nodes can be found (accessed) through one node, all marked as active and won't be cleared
4. Closures
var theThing = null;
var replaceThing = function () {
  var originalThing = theThing;
  var unused = function () {
    if (originalThing)
      console.log("hi");
  };
  theThing = {
    longStr: new Array(1000000).join('*'),
    someMethod: function () {
      console.log(someMessage);
    }
  };
};
setInterval(replaceThing, 1000);
Paste into console to execute, then look at memory changes through Performance panel trend line or Memory panel timeline. You can find very regular memory leaks (line steadily rises, one blue bar per second, straight as an arrow)
Because the typical implementation of closures is that each function object has an association pointing to a dictionary object, this dictionary object represents its lexical scope. If functions defined in replaceThing actually all use originalThing, then it's necessary to ensure they all get the same object, even if originalThing is reassigned over and over, so these (functions defined in replaceThing) share the same lexical environment
But V8 is smart enough to remove variables not used by any closure from the lexical environment, so if you delete unused (or remove the originalThing access inside unused), you can solve the memory leak
As long as a variable is used by any closure, it will be added to the lexical environment, shared by all closures under that scope. This is the key to closures causing memory leaks
P.S. For more detailed information about this interesting memory leak issue, please check An interesting kind of JavaScript memory leak
6. Other Memory Issues
Besides memory leaks, there are two other common memory issues:
-
Memory bloat
-
Frequent GC
Memory bloat means too much memory is occupied, but there's no clear boundary. Different devices have different performance, so it should be user-centric. Understand what devices are popular among the user base, then test pages on these devices. If the experience is poor, the page may have memory bloat issues
Frequent GC greatly affects experience (the feeling of page pause, because of Stop-The-World). You can see this through Task Manager memory size values or Performance trend lines:
-
In Task Manager, if memory or JS memory used values frequently rise and fall, it indicates frequent GC
-
In trend lines, if JS heap size or node count frequently rises and falls, it indicates frequent GC
Frequent GC issues can be solved by optimizing storage structure (avoid creating大量 fine-grained small objects), caching and reusing (such as using flyweight factory to implement reuse), etc.
No comments yet. Be the first to share your thoughts.